google-site-verification: googlefccb558c724d02c7.html

Translate

Tuesday, January 31, 2012

Online RBM Training -2: The UN's Programme Performance Assessment in Results-Based Management

--Greg Armstrong --


The UN’s Programme Performance Assessment in Results-Based Management, is a jargon-laden, time-consuming and partially out of date production that, whatever its original merits, is too frustrating to be useful today. There are more productive ways to spend your time.

Level of Difficulty: Moderate to Complex
Primarily Useful As: Difficult to say - a history of UN RBM jargon?
Most useful: Section 4-5 on data collection and reporting
Limitations: Out-of-date RBM language,jargon-laden, boring format


Background:

Online RBM training is unlikely to provide the hands-on practice and the opportunities for learning of group processes which are the foundation for effective Results-Based Management training and implementation, but some courses are definitely better than others.

After my December 15, 2011 post describing the University of Wisconsin’s effective interactive online results-based management course, I was asked by one reader for my opinion of other online RBM courses. The University of Wisconsin’s Logic Model course, is, in my opinion, excellent, making the most of interactive opportunities available in the absence of live training.

On the other end of the spectrum, however, is an online course available from the UN Office of Internal Oversight Services–Programme Performance Programme Performance Assessment in Results-based Management.


Google search results - Online Results-Based Management Training
CLICK image to enlarge

If we do a plain word search for "online results based management course" (without the quotes) on Google's .com search we will get, depending on the day, more than 80 million hits, and on page one of this search – at least as of January 31, 2012, the first and third results shown are for this specific UN RBM course.


Those search results may vary slightly given country-specific versions of the search engines, but  Microsoft's Bing and Yahoo search return several million results on this topic too, again with this UN RBM course ranking very high in the search results.


The highest ranked result --with a 2011 date-- is UNESCO’s Open Training Portal, and if we click on the UNESCO link, it takes us to what appears to be the home of the course, the UN’s Office of Internal Oversight Services, which is number 3 on the search list.  The course also appears as a link in some other UN documents.


So - how does this highly-ranked course stand up to scrutiny?


A disappointing use of the web

Thursday, December 15, 2011

Online Results-Based Management Training: The University of Wisconsin's Logic Model development course

Last Update:  March 7, 2023

The University of Wisconsin’s excellent online interactive Logic Model training is a valuable, easy to use introduction to RBM – and it is free.


Level of Difficulty:  Easy to moderate
Primarily Useful as: An introduction to RBM and Logic Models
Length: 3-5 hours online, 216 page downloadable PDF, and an 86-page teaching and training guide
Limitations:  No longer audio, but individual components are available for download

Who this is for

Like other consultants and trainers who work on international development issues, I usually work with groups, either donor or implementing agencies, training 10-200 people on RBM.  This reduces the cost (to them) of the training time, travel and other expenses.  But readers of this site or the RBM Training website sometimes ask if I can provide training on results based management  for individuals.  This would, however, be so expensive  that it would not be practical.  Other options such as enrolling in university courses in Europe or Canada might work, but often require more time, and again, more money, than an individual might be prepared  to invest.

But there is online, an excellent resource available to introduce RBM to anyone  who has no experience with RBM – or,  for that matter, to refresh even the most jaded RBM practitioner’s interest. This is the University of Wisconsin Extension Department’s Enhancing Program Performance with Logic Models.  Developed in 2002, originally put online in 2003, and revised in 2022 there is very little in this easy to use and interactive course, that is not still relevant today, in 2023 to those who are trying to understand how to use results-based management.

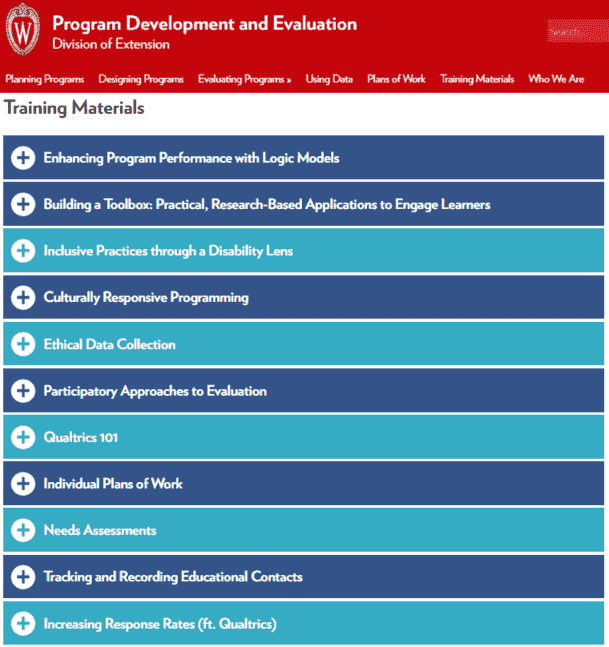
This course is one of 11 offered free by the Program Planning and Evaluation Division of the University of Wisconsin's Extension Department.

List of 11 course on program planning and evaluation
Program Planning and Evaluation courses offered by the Program Planning and Evaluation Division,
University of Wisconsin Extension Department


Format: Interactive Online learning and a number of downloadable components


When I first saw this course in 2011 it had both an interactive online format, and for those who did not want to, or could not use the internet for the 2-5 hours completion of the course takes, a PDF version of the course.  The real charm of this course, however, is that it is interactive, and it is the engaging nature of the interaction that cannot be replicated in the downloadable PDF.  The downloadable PDF version is still available, and the course itself has a number of useful additions including the boring sounding but very useful Document List, which has a 16 different downloadable documents including very practical worksheets and background information on social science issues. 

List of 16 documents for download in the Logic Model course
Downloadable components of the University of Wisconsin Online Logic Model Course


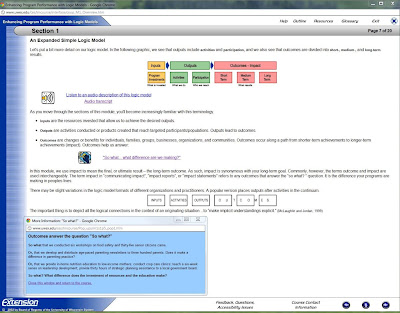
Presentations, in the course’s 7 sections, both audio and text, are supplemented with pop-up windows which participants can view, if they want additional examples or references,  followed with exercises and then feedback on the answers.

Logic Model explanation
University of Wisconsin Extension Online Logic Model Training


It should not be surprising that the interactive elements are as engaging as I found them to be, because this site was developed by a team of content and technical experts,at the Extension Department of the University of Wisconsin  – and extension departments are almost always the group in any university the most skilled in tailoring learning events to learners’ needs and learning styles.

Each of the course’s 7 sections contains tthe following elements

  • Section Overview
  • Section Goals
  • Section Outline with clickable links to the components of the section
  • Content presentation 
  • Activities that require us to put into practice the theory on the preceding pages.
Some of the sections also contain a section on the research or public administration background to the topic, and a bibliography.

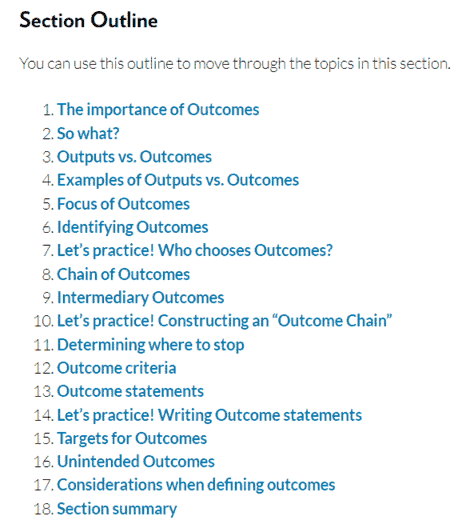
Here is what the Section Outline typically looks like, using Section which focuses on defining Outcomes: 

Example of an Outline for one component of the Logic Model Course, with 18 clickable topics
18 Clickable Topics in Section 2 on Defining Outcomes


Course Contents: Reinforcing important lessons about RBM


The course title is Enhancing Program Performance with Logic Models, but it deals with all of the associated elements of results-based management, not just the Logic Model.  Nothing in it will be a major surprise to people who work regularly with RBM, but the what this course teaches users about results-based management is worth repeating, simply because these lessons are often neglected or ignored, by even the most experienced users of RBM.

The course has 7 content sections, each of which generally takes between 20-40 minutes to complete.


What is a Logic Model?


Section 1 discusses the difference between Outputs and Outcomes, the need to test assumptions, and identify risk.  This section covers 20 screens in the course, and runs from pages 7-58 in the downloadable PDF. The difference is that in the PDF, transcripts of the audio from the online course, and a number of worksheets, are included as text.

This introduction to Logic Models includes, among much else, an interesting interactive Logic Model puzzle, requiring us to test our understanding of sequence, timing, risk and results, placing 20 different statement about a programme into one of 8 categories such as resources, activities, participants, Outputs, Outcomes, assumptions and external factors (or risk).

University of Wisconsin Logic Model course - interactive puzzle
Copyright: 2002, Board of Regents, University of Wisconsin
CLICK image to enlarge


This is not dissimilar to what you can do in a group with paper and scissors, but nevertheless engaging if you are working alone, and trying to ensure you understand the ideas of sequence, scale, change and other factors.


More about Outcomes


Section 2 takes us in detail through the different types of legitimate results that we can see in at individual, group, agency, system, or community levels, and talks about why participation of stakeholders in defining Outcomes is important.

This section includes material about RBM that more than one of the UN development agencies could usefully review.  Some of these agencies – not all, but some important UN agencies - get hung up on completing activities, (Outputs) and never seem to move on, in practice, to assessing whether these lead to any real change, or result (Outcomes).

Section two uses19 screens in the online course, and 32 pages in the PDF, with all of the associated supplementary material which is found in the pop-ups and links, in the online course.


More About Program Logic


Section 3  introduces (or reintroduces to forgetful RBM cognoscenti) the concept of clarifying the logic and assumptions implied in designing activities with the intention of contributing to a result.  It covers theories of change, the complexity of real-life programme logic, results chains – what it calls Outcome Chains -  and whether it is reasonable to claim causality – part of the current discussion on attribution of results to programme or project interventions.

It is important to note here, for those sometimes justifiably cynical about RBM who focus on complexity, that this course itself makes the point that multiple, often unplanned or unforeseen factors can affect results, not just the programme interventions. It also discusses the idea that a simple, linear logic model may not reveal enough of the factors involved in achieving results, and why more complex logic models may be needed to underpin the simple ones that we are often forced to submit to funding agencies.  

Another interactive exercise here, helps us to think through the theory of action behind a programme intervention, and despite the fact that this section has only 9 screens in the online course, and 24 pages in the PDF, the complexity of the interactive exercise on page 7 means it can take well 30 or 40 minutes to finish this section.


University of Wisconsin online Logic Model course, interactive exercise testing theories of action
Copyright: 2002, Board of Regents, University of Wisconsin
CLICK image to enlarge


This exercise is also an example of why, if you can, it is more productive in terms of learning to go to the online course first, before using the PDF, because with the PDF material there is essentially no chance to test your own understanding of the processes, before you see the “answer”.


What does a Logic Model Look Like?


Section 4 discusses why logic models, depending on the situation, purpose and culture involved,  can take many different forms.  There is no single format for Logic Models that suits all needs when the intellectual process of testing theories of change is involved – even though there may be, for any given donor, only one format they want to see.  There are, as the course points out, situations where Logic Models may differ in size and complexity, depending on whether they are being used to test ideas for programme planning, evaluation,  communication or for programme and project managers, the core of implementation activities.

Once again, note to complexity theorists, the course makes the point that logic models need not be simplistic, linear creations, but can be useful in helping agencies and individuals understand the complexity of the systems involved in interventions.
Examples of different formats for Logic Models
Logic Model formats - click to enlarge

This section takes 8 screens in the online course and there are several downloadable examples and worksheets.


How do I draw a Logic Model?


Section 5 is perhaps the most important of the course because it focuses on the real need to develop logic models as a group, not as an individual.

“As you work through this section, you will appreciate that the best way to construct a logic model is with others. While it may be quicker and easier to work alone, try not to. Many people believe that the real value of logic modeling is the PROCESS of creating one and the understanding and consensus that you build about a program as a result.”[Section 5, screen 1, PDF: p. 127]

I can only say I agree completely. In the Results Based Management training sessions I do with donor agencies, implementing organizations and national partners, feedback suggests that 80-90% of participants were absorbed by the Logic Model development process, sometimes surprised at how often the discussions reveal previously unknown or unacknowledged differences in perception among close colleagues, about what the original problem is, what risks and assumptions they have, and what reasonable results could look like.

5 different approaches to Logic Model development


All of the approaches focus on Logic Model development  a group.  The first four approaches are intended for planning new programmes.  These can be found at the online course, by clicking on the links at the bottom of the screen on creating a logic model for a new programme or on page 136 of the PDF.  All of these approaches begin with the result, and move back to activities and necessary resources.

  1. Start with the Long-term result or Outcome, and move back through mid-term or intermediate results, to short-term results, then to the Outputs needed to achieve these, then back again to activities and finally to inputs.
  2. Start with the long-term desired result, but then move immediately to activities, which is often the primary interest of participants, and then testing whether these will in fact, contribute to short of mid-term results which can logically relate to the long-term result.
  3. Start with the Long-term result, then brainstorm all of the elements that will affect this – activities, short, mid-term results, participants, risks, then sort them out to see if participants agree on the relationships and sequence.
  4. Juxtapose the situation or problem with a long-term desired change or Outcome then move  back through mid-term and short term results necessary to get there, and finally to participants, activities and resources required. This looks similar to the first option, but in fact really does, in practice in groups force those with preconceptions about what the activities should be, to confront the problem clearly, to look for results and then decide what activities and resources are needed.
  5. A fifth approach is also listed separately, on the next screen of the course, and this is for a situation where it is necessary to start logic model development with existing resources and existing activities. 
I have seen this happen where there is a second phase to a project, or where there is just too much institutional inertia to reconceptualize how to approach a problem.  It is essentially an approach focusing, as I see it, on a search for results to justify what is already being done – or as the this course suggests, where an “off the shelf” programme already exists:  Ask about an existing programme why each activity exists, what possible changes it can lead to, and how this can relate to a newly identified problem.
This approach is sometimes necessary, in my experience,  when working on RBM with universities, where activities such as degree course work and research are accepted as the core of university activities, and therefore the starting point for interventions.  It can also be necessary with some government agencies which  also sometimes see every problem through the paradigm of their own mandate and existing expertise.  
Moving such institutions towards a genuine questioning of what is really likely to achieve results is sometimes quite difficult.

How Good is my Logic Model?


Section 6 reviews some of the pitfalls individuals or RBM workshop facilitators may encounter in the development of Logic Models, including:

  • Getting lost in the RBM terminology,
  • Focusing too much on the mechanical aspects of putting activities and results in boxes, without assessing the plausibility of the connections between activities and results,
  • Focusing on – or complaining about – linearity, rather than exploring the complexities that some Logic Model formats can reveal,
  • Confusing the development of a Logic Model with evaluation, (for which it can indeed be a useful tool, but to which its utility is not limited)
  • Perceiving the Logic Model as a panacea for programme or project design or implementation problems, rather than as a tool to help us find possible solutions to such problems,
  • Focusing on production of the paper product, but never using it in practice.

It also makes the point that different people and agencies can use – or require the use of – Logic Models, for different purposes, and that we need to be clear about what this purpose is when we determine in how much detail we will work on Logic Model development.

This section spans 10 screens in the online programme, and 16 pages in the PDF version.


Using Logic Models in Evaluation  - Indicators and Measures


Section 7 reviews how understanding the original problem, assumptions, risk and the intended logic of the results chain can help agencies determine what evaluation questions to ask during different types of evaluations – questions about, and indicators relevant to:

  • The quality of inputs and completed activities (Outputs),
  • Who is participating, and what is the reach of the activities,
  • Assumptions underlying programme design, and selection of activities,
  • Whether results are actually achieved, and to what extent they can be reasonably attributed to the intervention, and
  • External factors –including what many agencies refer to as risk - on the achievement of results, or the failure to achieve results.

    Examination of a Logic Model and how it is formed can provide the foundation for

    • Needs assessments (assessing the original problem, and what can be done about it),
    • Process evaluations (assessment of inputs and the quality of activities)
    • Outcome and Impact evaluations (whether changes occurred and to what extent programme or project activities, and also external factors, may have contributed to such change).

    Section 7 is the longest of the course, with 20 online screens and 49 pages in the downloadable PDF.  The indicator discussions run from screens 9-20 in section 7, and pages 178-205 in the PDF.


    Glossaries and references on logic model development, RBM and evaluation


    The course, formally ends with section 7, but it is worth taking a look at other resources included:

    • The bibliography of references related to results based management and evaluation can also be reached by clicking on “resources” at the top of each screen or on pages 212-216 of the PDF.  The bibliography includes 72 references, 8 of which have clickable links that still appear to be functional.  Most of the 72  articles or references were written between 1994-2003, but it is worthwhile in particular visiting the Centers for Disease Control evaluation resources page which has a lot of very useful, accessible, and in some cases more current, guides on evaluation, logic models and data collection. The link in the bibliography is not current, but the page will automatically redirect to the new location, which I have provided in the previous sentence.

    • 11 additional links on evaluation issues such as questionnaire design, surveys, focus groups, quasi-experimental design and other issues can be found throughout section 7 online, or on page 199 of the PDF.

    • Finally, the course also provides links to 15 downloadable logic model worksheets or hints, in PDF and sometimes Microsoft Word format, also under “resources” at the top of each page.  These can also be found scattered throughout the PDF document.


    Limitation

    Because this course was developed in 2002 and redeveloped in 2022, most people will have computers capable of making use of the interactive elements of the site – but there is one potential limitation to this with some of the potential users in Africa, Asia or Latin America.   A reliable internet connection is needed to use the site, and in many of the places I, and my colleagues have work such connections can be, at times, unreliable.  You might, for example, have a half hour of access to read things like this blog, but it would be frustrating to be interrupted in the middle of this online course.
    Alternative provided: Users can download the 216 PDF version of the course, which includes the text of the whole course. 

     For those who are interested in training of trainers on RBM, the the Teaching and Training Guide is also useful, providing templates, schedules and outlines for activities.


    The bottom line:  This is an excellent introduction to results based management, focusing on logic model development, and its design is a credit to its authors' adult education abilities. It does not pretend to replace group workshops but it provides an intelligent, practical, and easy to use walk-through of the main issues in RBM.   

    _____________________________________________________________


    GREG ARMSTRONG
    Greg Armstrong is a Results-Based Management specialist who focuses on the use of clear language in RBM training, and in the creation of usable planning, monitoring and reporting frameworks.  For links to more Results-Based Management Handbooks and Guides, go to the RBM Training website


    Tuesday, August 02, 2011

    Podcasts 3: BBC's More or Less: Behind the Stats

    Greg Armstrong --

    This BBC Podcast brings indicator discussions to life. BBC radio's weekly podcast More or Less: Behind the Stats   presents an entertaining array of examples of how intelligent people can differ in their interpretations of indicator data, and how to apply common sense to the claims made using statistics, or other quantitative data.
    [edited to update links May 2013]
    BBC Radio's More or Less Podcast

    Level of Difficulty: Moderate and entertaining
    Primarily useful for: Policy makers, senior managers, Project stakeholders, donors, project managers, project monitors, and politicians of any nationality
    Length: 28 minutes (mp3 format)
    Limitations:  22 recent programmes are available for download but many older programmes are available only for listening online.

    Who this is for


    For project managers, donors, project monitors and policy makers who need to maintain a watchful eye on how indicator data are used, More or Less, provides some interesting examples of why it pays to be skeptical of indicator validity and reliability, the claims and the interpretations put on indicator data.


    Background: Surveying Results-Relevant Radio

    This is the third in a series of posts discussing how audio podcasts can reinvigorate thinking on indicators and results.

    The first post in this series discussed the mechanics of downloading and listening to podcasts. The second post surveyed the wide range of available podcasts from the BBC, ABC and National Public Radio  of potential use to people working on results and indicators.

    This post reviews what I think is the single most useful programme on world radio, for people who work with indicators:  BBC's More or Less: Behind the Stats.


    BBC Podcasts


    BBC is not the only source of intelligent programming available on the internet - there are, as I noted in my June 2011 post, several excellent programmes available from ABC, National Public Radio, and other sources.  But BBC radio has by far the widest range of podcasts to choose from.


    Roughly 9 Thousand available BBC podcasts


    The BBC podcast website  the last time I looked (August 2, 2011) had 287 programmes available for download. Of these, roughly half usually fall into categories such as music, comedy, sports, religion or children's programming but 129 programmes fell into the "factual" podcast category.  Each of these programmes has multiple -- some dozens, some hundreds -- of individual episodes available for download, or listening online.

    The BBC Radio 4 website  in early August 2011 listed more than 9,600 individual programme episodes, with almost 9,000 of them still available for listening in some format. This is in the "factual" category alone.  Some are BBC news programmes,  and despite recent cutbacks to the BBC foreign language programming, news is still available in many languages(see links at the end of this article). News programmes often cease to be available more quickly than other documentaries, for obvious reasons of topicality, but the last time I looked, there were roughly 90 available.

    Some of the nearly 9,000 available factual podcasts on radio 4 focus on consumer affairs, arts history or travel.

    But there are several which provide useful but also entertaining insights into the kind of work we do when we think about results and how to describe, measure or report on them.


    More or Less: Behind the Stats


    Of all the programmes I have found online, the most directly and consistently relevant to results-based management is More or Less: Behind the Stats. It has been hosted,  since October 2007, by economist Tim Harford, the engagingly skeptical author of The Undercover Economist, The Logic of Life, most recently Adapt  and many articles for The Financial Times and other publications. Tim Harford brings a common sense and clear language approach to determining whether claims for results, and the use of statistics to support such claims, are credible.

    Respect for Data


    In this, he continues the work of his irreverent predecessor, Andrew Dilnot, currently the chair of a U.K. Commission examining long-term health care for the elderly.  Andrew Dilnot set the tone for More or Less with his no-nonsense approach to data.  As The Guardian recently wrote about the Dilnot report, it is "Rich in evidence and pithy in prose" - and this is, after all, what we need more of, in all of our reporting.

    Dilnot wrote a few years ago that what is important in judging political leaders' claims is "respect for data over wishful thinking", something that could  be said equally of results claimed for development projects.

    "If you'd prefer to be flattered by bogus numbers, to believe that the world changes when you play statistical games, or at least to act as if it does, wrote Dilnot "you are, let's be blunt, delusional and dangerous."

    In a world where political leaders exhort aid workers to base -- and justify -- their programming decisions on indicator evidence, but themselves use evidence as the basis for policy only when it suits their political needs, this is something worth remembering.

    120 Available episodes of More Or Less


    More or Less has been produced since 2005 in association with the Open University  and their site has some supplementary written material. Additional interesting material is available also on Tim Harford’s other websites.

    The programme is updated for downloads every Friday during its broadcast seasons, and appears to have 2-3  broadcast seasons of 7-9 episodes each year.

    The More or Less website had, as of August 2, 2011, 22 episodes available for portable listening in the standard and (easiest to download) format - MP3. (A very rudimentary introduction on how to download and listen to podcasts, is available in my May post.)  Each current episode of More or Less is 28 minutes long, and they cover the period between September 2010 and May 2011, the most recent broadcasts.   An additional 28 streaming episodes of More or Less are available for listening -- but not downloading -- using the BBC Player, covering the period between January 2009 and August 2010.  A new season of More or Less begins in the first week of August 2011, and the September 2010 episodes will probably be archived before the new season ends.

    There are also older More or Less episodes, going back to February 2003, with Tim Harford or Andrew Dilnot,  but there is no point in trying to access those by clicking on the "previous programmes by year" link, because some work, and some don't.  But if you go to the More or Less Archives you can get 73 more episodes.   What is curious about these older archived programmes is that some - such as the earliest available episode of More or Less in February 2003, do have audio you can listen to, albeit in the sometimes problematic ram format, while others, including some later programmes, simply have a written description, but do not, as far as I can see, have an audio component. All six of the More or Less episodes broadcast between February and March 2003 have audio, for example, but none of the six episodes broadcast in January and February 2004 appear to have audio.

    Nevertheless, all things considered, I estimate that that there are probably about 120 episodes of More or Less that you can listen to one way or the other and as the new season arrives there will be more.

    A wide range of indicators


    Each episode of More or Less usually deals with discussions of 5-6 indicator issues. Recent episodes, for example, have included discussions on indicators related to, among many other subjects

    • measuring child poverty
    • calculating civilian deaths in war zones
    • comparing international data on student achievement
    • measuring well-being
    • abuses of statistical significance claims
    • measuring the "fiscal multiplier"
    • how luck, and regression to the mean, can bias data interpretation
    • whether celebrity (or royal) marriages - or crime - lead to jumps in marriage rates
    • calculating the real costs of military interventions
    • how differences in data definitions can bias international comparisons
    • distinguishing between correlation and causation
    • how different  methods of calculating "averages" can affect indicator data


    Using More or Less as a research tool: What the data said about 2010


    While many of the items on More or Less use examples from the United Kingdom, it is easy to see how lessons from the debunking of claims about problems or results, could be applied to other issues, and other countries.

    A useful starting point for anyone wanting to test the More or Less range of issues, is the December 31, 2010 downloadable episode. The MP3 version of this episode can currently be downloaded from the main More or Less website, with 21 others, but it will soon be archived, and then you will need to go to the BBC player version of the programme, where currently the most recent 48 episodes are available, and listen online.


    "The meat and drink of More or Less are the errors and connivances embedded in the statistics which fill each news bulletin" Tim Harford noted in the final programme of 2010.  And this episode illustrates his point, as it produces the most important numbers of 2010, as seen by 7 people who work regularly with indicator interpretation.

    Examining one episode in slightly more detail provides an example, I hope, of how we can use podcasts to stimulate ideas and, with a little effort, further research on indicators. As there are no clickable links in podcasts (at least not in this one), the references below are to the time (in minutes and seconds) into the podcast where you can find the reference.

    Included in the 2010 Year-End summary of indicators in the news:

    Indicator data on crime and social change

    (00:56)
    Daniel Franklin   Executive Editor of The Economist, and editor of The World in 2010 and The World in 2011, discusses the difference between David Cameron's claims on crime and a "broken society" and what the statistics on crime rates, teen pregnancy, smoking and other issues say. Some of this is reflected also in the data on percentage of births to teenage mothers, suggested by National Statistician Jil Matheson (08:24-10:19)

    It is easy to see how these discussions on falling crime rates and the implication for public policy could apply to other countries, such as Germany  the U.S. or Canada 

    Indicators on defence spending

    (02:30 into the episode)

    Cathy Newman, former correspondent for the Financial Times, now political correspondent for Britain's Channel 4 news, and author of the Factcheck Blog contrasts former Prime Minister Gordon Brown's claims that defence spending rose in real terms in recent years, while data on inflation - adjusted spending suggested defence spending had fallen.  She points out the difference between "cash spending" and "real spending", and she also notes that the Conservative - Liberal Democrat coalition government will be reducing the defence budget by about 8% in real terms over the next four years.

    Misleading indicators on immigration

    (04:25)

    Tim Harford highlights the need to check indicator data sources, before making extravagant claims. He shows how Liberal Democratic party leader Nick Clegg's election debate claim that 80% of immigrants to the UK came from the European Union, was based on his party's misreading of an Economist article, which referred to students, not immigrants.  The real figure Harford says, and a report in the Daily Telegraph  appears to confirm, is about 39%. It is not known from any of these sources if the use of the faulty data was sloppy party research or careless use of the data in the debate.

    Compared to what? Risk indicators

    (07:30)

    David Spiegelhalter, The Winton Professor of the Public Understanding of Risk  at Cambridge University, talks about the need to put risk indicators in perspective.  He examines risks for the military in Afghanistan, and compares these to the risk of riding a motorcycle on a major highway in the U.K.

    Hans Rosling on the quality of indicator data

    (10:30-18:10)

    In the longest discussion in this episode, Hans Rosling, co-founder of the Gapminder Institute, who will be familiar to many people from his entertaining presentations on indicators , talks about how indicator data on issues such as child mortality and economic growth differ widely country to country in sub-Saharan Africa.

    When questioned about the reliability of indicator data from under-funded African statistical offices, he explains why some indicator data such as child mortality and fertility rates are reliable, while other data on indicators such as maternal mortality and unemployment are not.


    But, Hans Rosling says:

    "It is not countries that have weak indicators. It is certain indicators that are weak for methodological reasons". (13:23)

    There is much more in this interview with Rosling, on:
    • Indicators on fertility;
    • Rates of change to indicators such as child mortality, and economic growth in China;
    • Disaggregating indicator data and defining geographic focus for indicators; 
    • His conclusions about the relationship between economic improvement, good governance and democracy;
    • The difference between ideals and advocacy, and facts.

    Finding an indicator for the "slippery concept" of well-being
    (18:37-20:24)

    Statistician Michael Blastland  former producer of More or Less, co-author with former host Andrew Dilnot of The Numbers Game: The Commonsense Guide to Understanding Numbers in the News, in Politics, and in Life , and author of a regularly published column on the BBC News online Magazine on making statistics relevant to non-statisticians, considers whether insomnia can be taken as an indicator for wellbeing - and concludes "...Well-being: this is a good illustration of how slippery a concept that is and the number of things that might have to go into it".

    Dealing with slippery concepts is something development aid workers will be familiar with.


    Cash as an indicator of bank viability

    (20:26)

    Robert Peston, Business Editor at the BBC  talks about how the amount of cash banks have on hand as a percentage of what they borrowed, is an indicator of possible bank failures. Comparing British banks at the end of 2008, with British banks during the Great Depression, he comes up with some surprising information.  It is presumably still relevant in 2011, but the interview never quite makes clear how

    How Incomplete Data reporting undermines indicator utility

    (22:50)

    Ben Goldacre, a physician, the author of the Bad Science blog, a book of the same name, and a columnist for the Guardian  uses the case of incompletely reported data on the drug reboxetine   to illustrate how published studies on drug effectiveness provide unreliable indicators for safety and effectiveness because of the way data are both withheld, and then reported. While this brief comment focuses on this one drug, his blog has discussed several other examples of how inaccurately reported data on drug trials can be, to put it mildly, unreliable.  These include, within the past year, reviews of a medicine for schizophrenia that may cause diabetes, a diabetes medication that may increase risks of heart attacks  and several critiques on claims for homeopathic medicine.

    This short session of More or Less with Ben Goldacre is of relevance for those involved in results reporting for any field. Checking the methods and context for any research providing us with indicator data, is something that is often neglected as indicators are used in reports on development projects.  Failing to check out the sources for published results supporting results indicators in development projects, however, rarely has such immediately dangerous implications as does careless - or malevolent -  use of indicators  in the field of medical research.

     For an entertaining infographic on Bad Science see the Bad Science Infographic.


    Limitations:


    Unbundling....other programmes do it:

    As I noted in my previous survey of a number of results-relevant podcasts, several -- such as ABC's Counterpoint unbundle the programmes -- break them down into components that can be downloaded separately.  ABC Radio's The Science Show  makes the case for this when it says:
    "The whole program cut up into separate stories - allows easy skipping from one story to the next so you can pick and choose".  
    What is also useful is that the Science show also makes transcripts available for many episdoes, so having listened to it, it is relatively easy to go back, check data and follow up.

    Some (but not all) episodes of the National Public Radio show RadioLab  also do this quite well, dividing an episode which has its own internal coherence, into 3-4 components available separately and with their own references.  You can see examples of these, among many others, with the May 31, 2011 episode on talking to machines  or the June 2009 episode on randomness and data patterns  (stochasticity).  There may be some BBC programmes that do unbundle their podcasts by themes, but I haven't found them yet.


    Time limits: 

    While the 22 recent episodes (this will undoubtedly change in August 2011 with the new season) are available for download and portable listening, and readers can listen to, but not download, many others  dating back to April 2003, some of the programmes prior to 2005 do not open easily. The easiest to download format - the MP3 versions currently available for the last 22 episodes - are usually only available in that format for a year. So if you want to be sure you can download and save some of the interesting episodes, it is worth skimming the site first, identifying potentially interesting episodes, and downloading them  before they are archived or go to the BBC Player site.  The September 2010 episodes will probably be archived soon.


    Weak research links:

    More or Less is relevant to those who work with results and indicators, but of course it provides just tantalizing summaries of the issues, not the whole picture.  It is natural that many of us would want to do further research online to follow up on the issue summaries in each episode.  This is the whole point of being online - to get access to multiple sources of data.  We can, of course, do our own research, and many of the links I provided earlier in this post when I discussed the 2010 New Year's episode of More or Less, were links I did find myself, through some time-consuming research.

    While the More or Less website has improved since January 2011, and particularly since the April 2011 season, it is still a disappointment that there is so little assistance on the site for further research, particularly for some of the programmes that predate 2011.  The More or Less website does indeed now provide more links that it previously did, both directly and through the Open University link, but there remain occasional problems even in these links.  In at least one case I noted in January 2010 the site misspelled the name of one of the guests (Ben Goldacre)  and that error remains as I write this in July.  Such things prove distracting, and complicate attempts to follow the story online with further search. While it is easy to make errors in writing (and this blog undoubtedly has some) there is a certain irony in finding such an error on the website of a podcast dealing with data integrity.

    Other podcasts such as RadioLab have websites that provide much more in terms of links to further research, and in RadioLab's case, even have a reading list.  None of these other programmes has the direct and frequent relevance to results and indicators that More or Less has, but they are better organized.

    More or Less is, as I have said, the most useful of all of the programmes I have found so far, to those of us who work with results and indicators, and it is disappointing that the website does not make it easier to capitalize on the good work they have done.  More links to background material on the More or Less website would be useful as would even the inclusion of metadata accessible to listeners who might want to go further.


    The Bottom Line:

    More or Less: Behind the Stats, is the most useful programme on the internet for people interested in how indicators are used in daily life, in policy analysis, politics and assessing results.  It is worth listening to, for most people involved with results-based management.  A new season of More or Less begins on August 5, 2011.


    Further Reading, viewing and listening on indicators and results


    For our colleagues working in other languages - BBC foreign-language news

    BBC News in Persian
    BBC News in Mandarin
    BBC News in Cantonese
    BC News summaries and commentary from the press in Turkish
    BBC News in Burmese
    BBC News and commentary in Russian
    BBC News Analysis in Ukrainian
    BBC News in Indonesian
    BBC News in Spanish

    At some associated BBC sites, languages such as Swahili are available, but not as regular news broadcasts.


    _____________________________________________________________


    GREG ARMSTRONG
    Greg Armstrong is a Results-Based Management specialist who focuses on the use of clear language in RBM training, and in the creation of usable planning, monitoring and reporting frameworks.  For links to more Results-Based Management Handbooks and Guides, go to the RBM Training website


    RBM Training

    RBM Training
    Results-Based Management

    Subscribe to this blog by email

    Enter your email address:

    Delivered by FeedBurner

     
    Read the latest posts